

Loading

Industry

Infrastructure & Utilities

Drone mapping, aerial inspections and 3D models for safer, better-managed infrastructure.

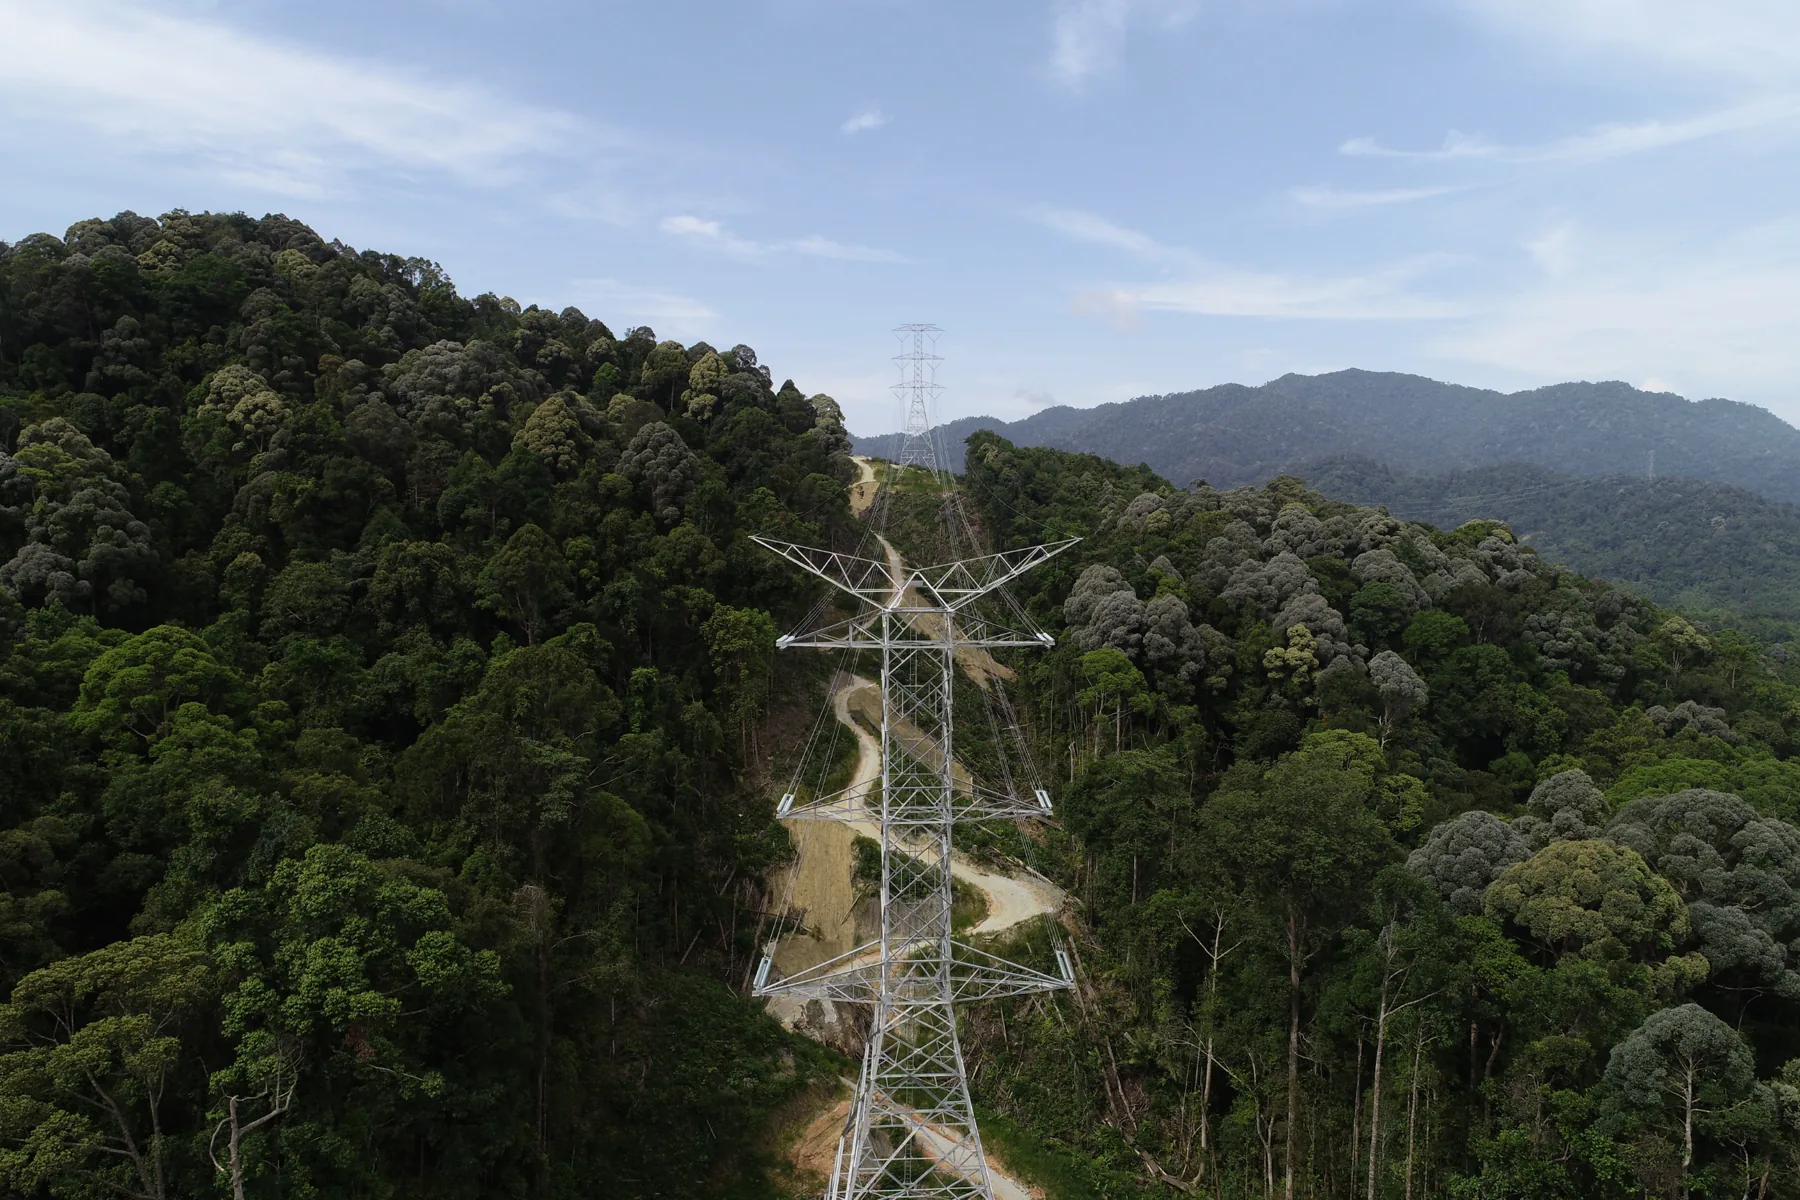
Aerial view of a high-voltage transmission tower on a forested ridge in Malaysia, with the cleared line corridor and access track running back to a second tower
Corridor mapped
32 km in half a day
Check accuracy
RMSE 0.06 m
Data type
Classified 3D point cloud
Reporting
Schematics at 1 km intervals

Capabilities in this sector

The named services AECA delivers here. Each one answers a problem set out below.

Utility Corridor Mapping

Power, water and gas corridors run for tens of kilometres through terrain nobody can walk inside a maintenance window.

Road Measurement / Alignment / Recalculation

Built alignments drift from the design, and re-measuring by ground crew means closing lanes.

Road Asset Management and Defect Detection

Inspection backlogs mean defects are found by the public before they are found by the asset owner.

Industry challenges

Corridors, bridge networks and live construction sites are inspected by crews on foot, inside maintenance windows that are never long enough.

Manual inspection delays validation

Ground-crew inspection holds up earthwork validation and leaves asset managers blind to minor deviations until they have grown into rework.

Hard-to-reach structures carry real liability

Finding cracking or micro-degradation on bridge decks and high-elevation utility structures brings safety liability and expensive scaffolding overruns.

Point-by-point survey does not scale to corridors

A 20 km highway or rail corridor took weeks of static stations and return visits, with teams working close to live traffic throughout.

No comparable record between inspections

Where each inspection uses a different crew and method, the results cannot be differenced, so deterioration rate stays unknown.

AECA's solutions

Three capabilities, applied across the asset life cycle from construction through operation and maintenance.

As-built digital twins

Interactive 3D models for progress auditing and design comparison, so what was built can be checked against what was drawn.

Linear corridor mapping

Topographic data and cut/fill analysis for roads, rail and pipelines, with geometry, surfaces, markings, signage and roadside structures recorded in a single pass.

Structural integrity inspections

High-resolution defect data on decks, faces and high-elevation structures, without scaffolding or rope access.

Benefits

What changes for an asset owner once capture is aerial and mobile rather than manual.

  • Faster data capture A corridor or structure is recorded in a single pass rather than across repeated visits, so the survey stops being the constraint on the programme.
  • Crews off the live asset Inspection happens from the air or from a moving vehicle, removing the exposure that comes with working on active carriageways and at height.
  • Predictive maintenance Repeat capture against fixed control turns condition into a trend rather than a snapshot, so intervention can be planned before failure.
  • Budget and risk optimisation Measured condition across the whole asset directs spend at what is deteriorating, and the capture is reusable rather than repeated.

Case studies

How the data has translated into decisions on real infrastructure.

Mobile LiDAR railway corridor mapping

The challenge
Corridor inspection meant teams walking the tracks and photographing what they saw, which exposes personnel to an active railway and returns nothing comparable year on year.
The deployment
A Scanfly mobile mapping system on a railway maintenance trolley ran the alignment during approved windows, capturing LiDAR, 360 degree imagery and georeferencing in a single pass, with VStream Revolution and crew holding Personal Track Safety passports.
The result
The full 32 km corridor mapped in half a day, classified into ground, vegetation, wires, overhead assets and potential encroachments, and summarised as schematic maps at 1 km intervals.


Retaining wall and slope survey beside a former mining lake

The challenge
The retaining wall beneath South Quay stabilises ground that falls 40 metres below sea level, and conventional survey cannot read terrain under the canopy wrapping the lake.
The deployment
Drone LiDAR with the Scanfly Ultra X and a Hesai XT32M2X sensor, flown inside an active construction zone hemmed in by dense trees and tall buildings.
The result
Point clouds of the wall and slope plus a digital elevation model beneath the foliage, checked at 0.06 metres RMSE, used to assess wall condition, landslide risk, erosion and drainage.

Digital infrastructure at scale

The challenge
As transport and utility networks expand, point-by-point survey is too slow and costly to scale, and operators carry the hidden cost of repeated visits and traffic management.
The deployment
Mobile LiDAR ecosystems such as Scanfly combine high-density scanning, direct georeferencing and sensor fusion to record highway, rail and utility corridors in a single pass.
The result
Manual documentation replaced with continuous, reusable digital twins that each maintenance and design cycle revisits rather than re-surveys.

Turn insight into action

Solve your next operational challenge.

Tell us what you need to measure, monitor or manage.