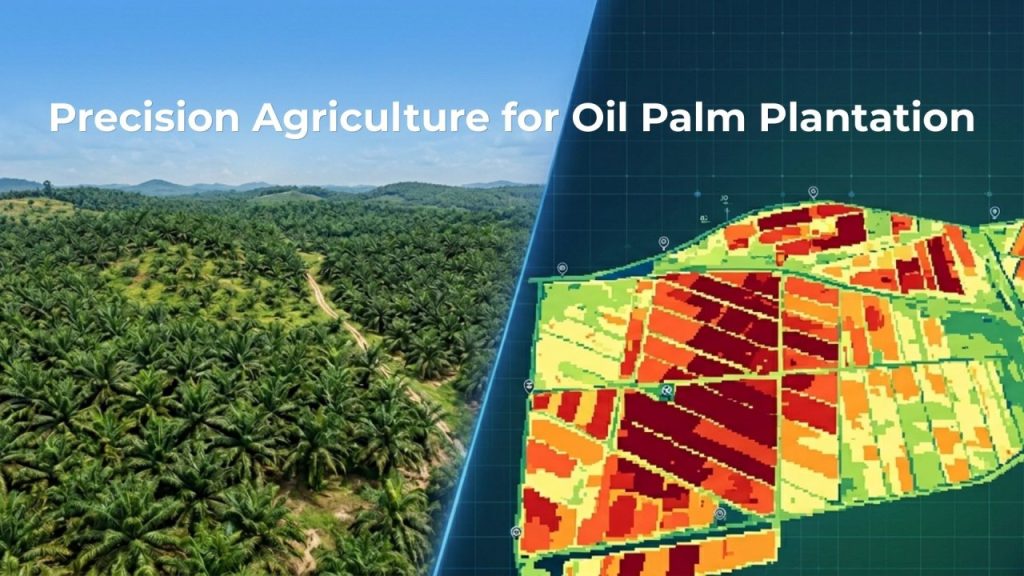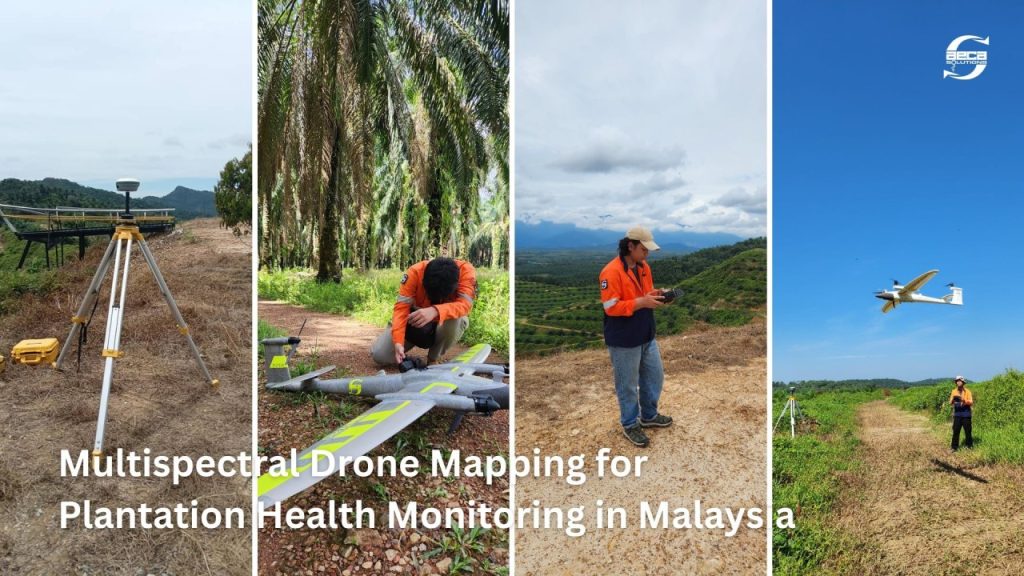

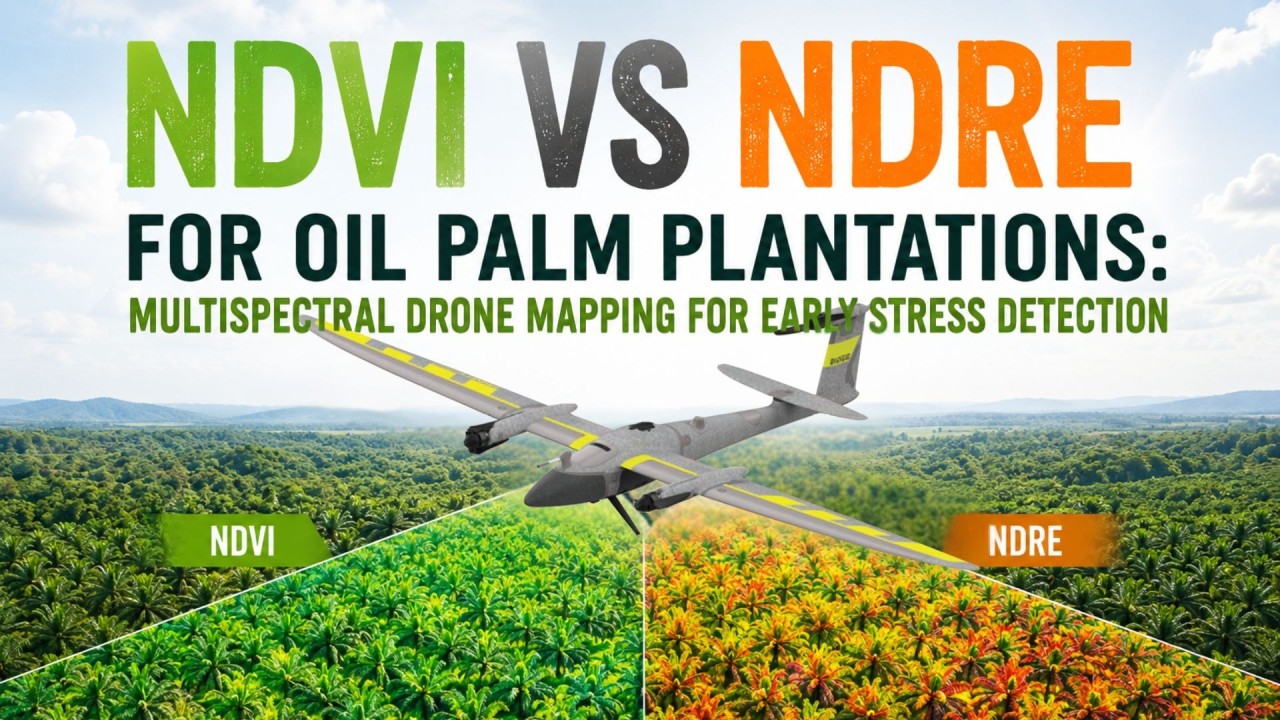
Discover how NDVI (Normalized Difference Vegetation Index) and NDRE (Normalized Difference Red Edge Index) are used in multispectral drone mapping to detect early plantation stress in oil palm estates. Our case study from Malaysia showcases how precision agriculture and aerial mapping help improve plantation monitoring, fertilization planning, and yield management
For plantation operators searching for practical ways to detect crop stress earlier, improve fertilizer efficiency, and monitor estate health at scale, NDVI and NDRE have become two of the most important indices in precision agriculture and multispectral drone mapping workflows.
NDVI the Normalized Difference Vegetation Index is the most widely deployed plant health metric in precision agriculture. It has decades of research behind it, global benchmarks, and broad software support. In plantation management circles across Malaysia and Southeast Asia, it has become shorthand for aerial health monitoring itself.
But NDVI has a ceiling. And for mature, high-canopy crops like oil palm, that ceiling matters enormously because the stress signals that cost the most money are precisely the ones NDVI detects last.
This is the case for NDRE the Normalized Difference Red Edge Index and for understanding why these two indices are not competitors but complementary tools that together give plantation managers a genuinely complete picture of crop health.
What is NDVI in plantation health monitoring?
NDVI measures the difference between the Near-Infrared (NIR) and Red light reflected by a plant canopy, expressed as a ratio:
NDVI = (NIR - Red) / (NIR+ Red)Healthy, photosynthetically active plants absorb red light strongly using it for photosynthesis and reflect Near-Infrared light intensely. Stressed, damaged, or dead vegetation does the opposite: less NIR reflectance, more red light passing through. The NDVI formula captures this contrast and produces a score between −1 and +1.

NDVI is reliable, well-understood, and gives a clear broad-canvas picture of canopy health across an estate. It is the right starting point for any vegetation health assessment.
But it has two important limitations for mature plantation crops specifically.
- NDVI saturates at high biomass. In a dense, mature oil palm canopy, the sheer volume of healthy green vegetation can mask subtle early stress signals in individual trees. The index reads the canopy collectively and the collective can appear healthy while individual trees are already in early decline.
- NDVI detects stress late. Because it measures the visible consequence of stress structural and pigment change rather than the early biological cause, it typically flags problems only after they have already significantly progressed. By the time NDVI shows a problem, a field team on the ground might spot it too.
What is NDRE and why is it important for oil palm plantations?
NDRE the Normalized Difference Red Edge Index uses a different spectral band in place of the visible Red channel:
NDRE = (NIR − Red Edge) / (NIR + Red Edge)The Red Edge band occupies the 700–740 nanometre wavelength range a narrow spectral region where chlorophyll absorption transitions sharply. This region is directly sensitive to chlorophyll concentration and leaf nitrogen content, two of the earliest biological markers to shift when a plant is under stress.
This is the key distinction: NDVI measures what stress looks like. NDRE measures what stress begins to do at the cellular and biochemical level before it becomes visible in the plant’s structure or appearance.
For mature crops and oil palm is one of the highest-canopy, highest-biomass plantation crops in the world NDRE consistently detects stress 2–4 weeks earlier than NDVI. In a crop where late intervention means months of suppressed yield, and where replanting timelines are measured in years, those weeks translate directly into tonnes per hectare and ringgit per estate.
What NDRE catches that NDVI misses:
- Nitrogen deficiency weeks before visible yellowing begins
- Early water stress before canopy structure or colour is affected
- Subtle chlorophyll decline in trees that still appear visually green and healthy
- Zone-level fertility variation within an estate that looks uniform from above in RGB photography

NDVI tells you a tree is sick. NDRE tells you a tree is getting sick while you can still do something about it cheaply.
How are NDVI and NDRE actually obtained? Multispectral drone mapping explained
NDVI and NDRE are indices mathematical calculations. To calculate them, you need the underlying spectral data: reflected light values at specific wavelengths. And to collect those values at plantation scale, you need the right sensor platform.
RGB Drone Mapping vs Multispectral Drone Mapping for Plantations
Most commercial drone surveys use standard RGB cameras, capturing Red, Green, and Blue light. RGB imagery produces detailed, visually rich aerial photographs. It is excellent for estate mapping, canopy structure assessment, and visual inspection.
But RGB cameras cannot produce NDVI or NDRE. They do not capture Near-Infrared or Red Edge wavelengths. They see the plantation the way the human eye sees it which means they share exactly the same limitation: they cannot detect early biochemical stress that has not yet changed the plant’s appearance.
RGB drone mapping gives you a high-resolution photograph of your plantation. Multispectral drone mapping gives you a biological reading of your plantation. They are not the same thing.
A multispectral sensor captures light across multiple discrete spectral bands beyond the visible spectrum specifically including Near-Infrared and Red Edge. With these bands captured simultaneously during a single drone flight, NDVI and NDRE can be calculated for every pixel across the entire mapped area.
The sensor: MicaSense RedEdge-MX
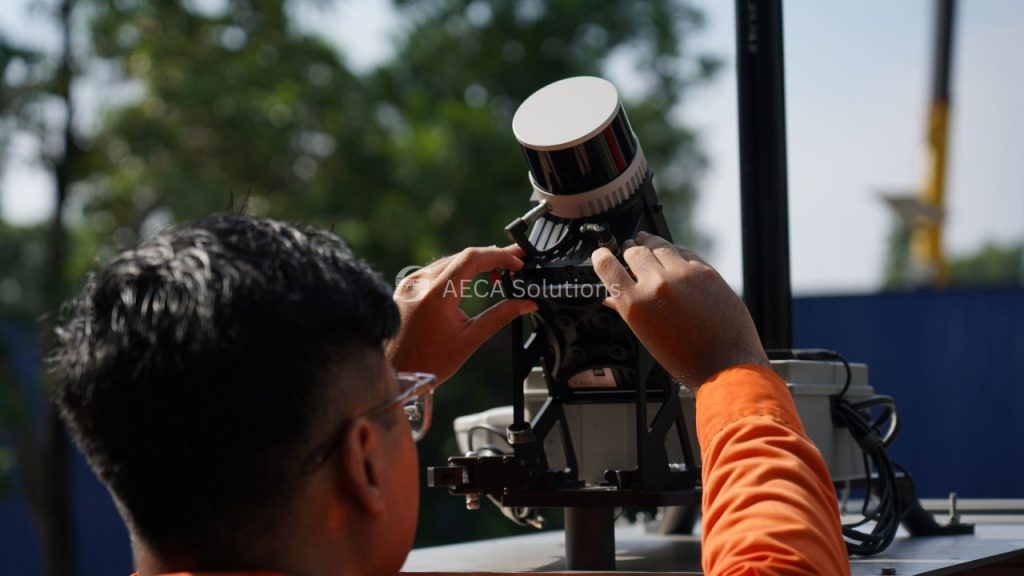
In the Rubber Industry Smallholders Development Authority (RISDA) project across 10,232 hectares of Malaysian oil palm, AECA Solutions deployed the MicaSense RedEdge-MX, a purpose-built agricultural multispectral sensor that captures five discrete spectral bands per flight:

All five bands are captured simultaneously, in a single pass, with full spatial alignment meaning NDVI and NDRE maps cover exactly the same ground at the same moment, with no temporal gap between the two datasets.
Each flight was preceded by radiometric calibration using reflectance panels a critical step that converts raw sensor readings into physically meaningful reflectance values. Without calibration, index values from different flights, different days, or different weather conditions cannot be reliably compared. With it, results are reproducible and directly comparable across estates and seasons.
The UAV platform: Quantum Systems Trinity F90+ (eVTOL fixed-wing)
Collecting multispectral data at 10,000+ hectare scale demands an aircraft designed for large-area coverage. The Trinity F90+ is a hybrid eVTOL (electric Vertical Take-Off and Landing) fixed-wing drone combining the ground logistics simplicity of a multirotor (vertical launch and recovery, no runway required) with the endurance and coverage efficiency of a fixed-wing aircraft.
At 210 metres altitude with 75% front and side overlap necessary for accurate photogrammetric processing and seamless index maps the Trinity F90+ completed 54 missions across 8 estates in 4 Malaysian states over 21 operational days. A standard multirotor platform would have required a multiple of that time.
Can NDVI and NDRE be obtained any other way?
Yes and understanding the alternatives clarifies why drone-based multispectral mapping is the practical choice for active plantation management.

Drone-based multispectral mapping occupies the practical optimum: high enough resolution for individual tree classification, low enough cost for repeatable monitoring cycles, flexible enough to operate across dispersed multi-estate programmes, and capable of producing both NDVI and NDRE in a single flight.
How it works in practice: the stress timeline
The most intuitive way to understand the difference between NDVI and NDRE is to follow a single oil palm tree through a nitrogen stress event week by week.

The gap between Week 3 and Week 6 is the entire economic case for NDRE alongside NDVI. Not a marginal improvement it is a fundamentally earlier conversation with the crop.
RISDA Malaysia Case Study: Using NDVI and NDRE for Plantation Stress Detection
AECA Solutions was commissioned by Rubber Industry Smallholders Development Authority-RISDA (Pihak Berkuasa Kemajuan Pekebun Kecil Perusahaan Getah), Malaysia’s national smallholder development authority for a large-scale multispectral drone mapping program across 8 oil palm estates in Peninsular Malaysia.
AECA Solutions deploys multispectral drone mapping workflows for plantation monitoring, precision agriculture analysis, and large-area vegetation health assessment across Malaysia and Southeast Asia.
Both NDVI and NDRE were calculated across all 8 estates and combined with AI-based individual tree detection to produce estate-level and zone-level health classifications.
For the full case study on how both indices were deployed across 10,232 hectares of RISDA oil palm estates in Peninsular Malaysia including the technology stack, operational methodology, AI-based tree classification findings, and management implications, read the case study: https://tinyurl.com/planthealthmonitoring
Key finding: Over 85% of trees across all 8 estates classified as healthy or very healthy. Early-stage stress detected and spatially located in specific zones via NDRE before yield impact, and before the stress was visible in NDVI or RGB imagery. Approximately 220,000 trees flagged for targeted intervention. All GPS-located. All classified by severity. All invisible before the survey.
The combination of NDVI and NDRE, processed through the multispectral pipeline and overlaid with AI-based tree detection produced the complete picture: a broad-canvas health assessment from NDVI, and an early-warning stress map from NDRE, cross-referenced at individual tree level.
Conclusion: Using NDVI and NDRE together for smarter plantation management
For oil palm plantation management where stress-to-yield timelines are measured in months, replanting timelines in years, and input costs are under pressure across the region the choice between NDVI and NDRE is a false one.
NDVI gives you the global standard, the historical comparability, and the broad structural health picture. NDRE gives you the early warning, the 2–4 week head start on intervention that determines whether you’re correcting a problem cheaply or managing a consequence expensively.
NDVI shows you the plantation as it is. NDRE shows you where it is going. Precision agriculture, properly deployed, gives you both.
Both indices are produced from the same multispectral drone flight, the same sensor, the same data collection effort. There is no additional cost to having both. There is a significant cost to having only one.
AECA Solutions supports plantation operators across Malaysia and Southeast Asia with multispectral drone mapping, vegetation health analysis, and precision agriculture workflows designed for large-area monitoring.
If you’re evaluating how early stress detection and spatial health analysis could support your operations, feel free to connect with us.
And for those already working with plantation monitoring workflows. What is currently the biggest limitation in your plantation monitoring process?
We’d love to hear from you in the comments!